Economic performance is stronger when Democrats hold the White House
🌈 Abstract
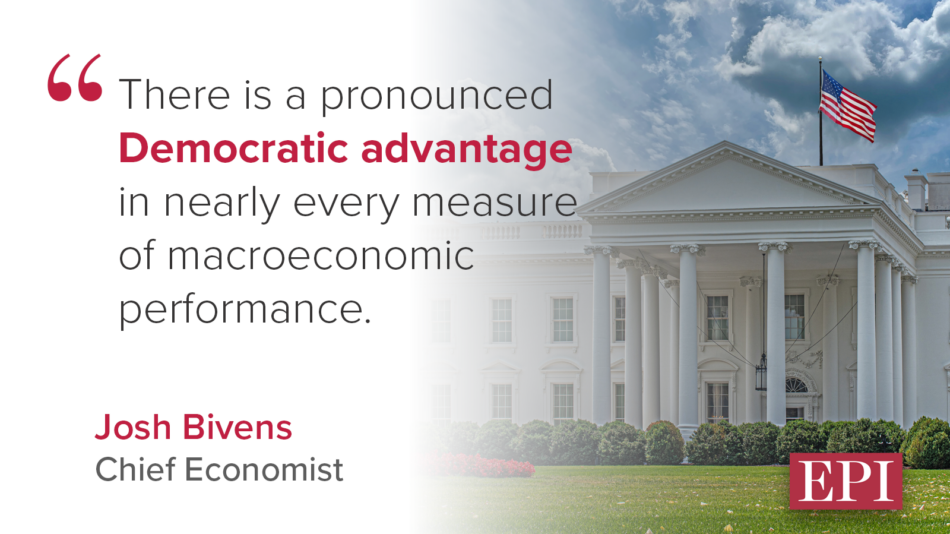
The article examines the economic performance of the United States under Democratic and Republican presidents, finding that the economy has consistently performed better under Democratic administrations across a range of key macroeconomic indicators. It also finds that economic growth under Democratic presidents has been more equally distributed across income groups.
🙋 Q&A
[01] Aggregate Results
1. What are the key macroeconomic indicators examined in the article, and how do they compare between Democratic and Republican administrations? The article examines the following key macroeconomic indicators and finds a consistent Democratic advantage:
- Real GDP growth
- Real net domestic product per capita growth
- Total and private job growth
- Unemployment rate (including for Black jobseekers)
- Real wage growth
- Real business investment growth
- Real personal income growth (excluding government transfers)
- Inflation (both overall and core)
- Federal funds rate
2. How large are the differences in performance between Democratic and Republican administrations? The differences are quite large. For example, real GDP growth is 1.2 percentage points higher on average under Democratic presidents, which would translate to an additional $330 billion in annual income for US families. The Democratic advantage is even larger for measures like real net domestic product per capita growth.
3. How does the article address potential concerns about the time period examined? The article examines performance both for the full period since 1949 as well as just the post-1980 period. This helps address concerns that the results may be driven by very old data or structural changes over time. The Democratic advantage persists in both time periods.
[02] Distributional Results
1. How does income growth differ between Democratic and Republican administrations across the income distribution? The article finds that income growth is faster and more equally distributed under Democratic administrations. This holds true for both pre-tax money income and post-tax, post-transfer income measures. The Democratic advantage is largest for lower and middle-income groups.
2. Can you provide some specific examples of the differences in income growth? For the full 1949-present period, income growth for the bottom 20% was 188% faster under Democratic presidents. For the middle 60%, income growth was 48% faster. Even for the top 5%, income growth was about 10% faster.
3. Does this pattern of more equal income growth continue in the more recent post-1980 period? Yes, the article finds the Democratic advantage in more equal income growth persists even when focusing just on the post-1980 period.
[03] Conclusion
1. How does the article characterize the large and consistent Democratic advantage in economic performance? The article notes that the size of the Democratic advantage "strains credulity" given the limited direct control the president is thought to have over the economy. It suggests this information is important for voters to have when assessing which party is likely to be better economic managers.
2. What potential explanations does the article consider for the partisan differences in economic performance? The article acknowledges that factors like luck and chance play a role, and that presidents do not have total control over the economy. It suggests that those who prefer Republican policies may view the Democratic advantage as simply "bad luck" for their preferred policies.
3. Overall, what is the key takeaway of the article? The key takeaway is that the data clearly show a pronounced and consistent Democratic advantage in macroeconomic performance and income growth distribution, which is an important consideration for voters despite the limitations on the president's direct control over the economy.