Clouded Judgement 8.2.24 - Uncertainty Everywhere

🌈 Abstract
The article provides updates on the latest trends in cloud software companies, covering topics such as economic uncertainty, software-specific data points, and the quarterly reports of major cloud providers.
🙋 Q&A
[01] Uncertainty Everywhere
1. What are the key points regarding the current economic uncertainty?
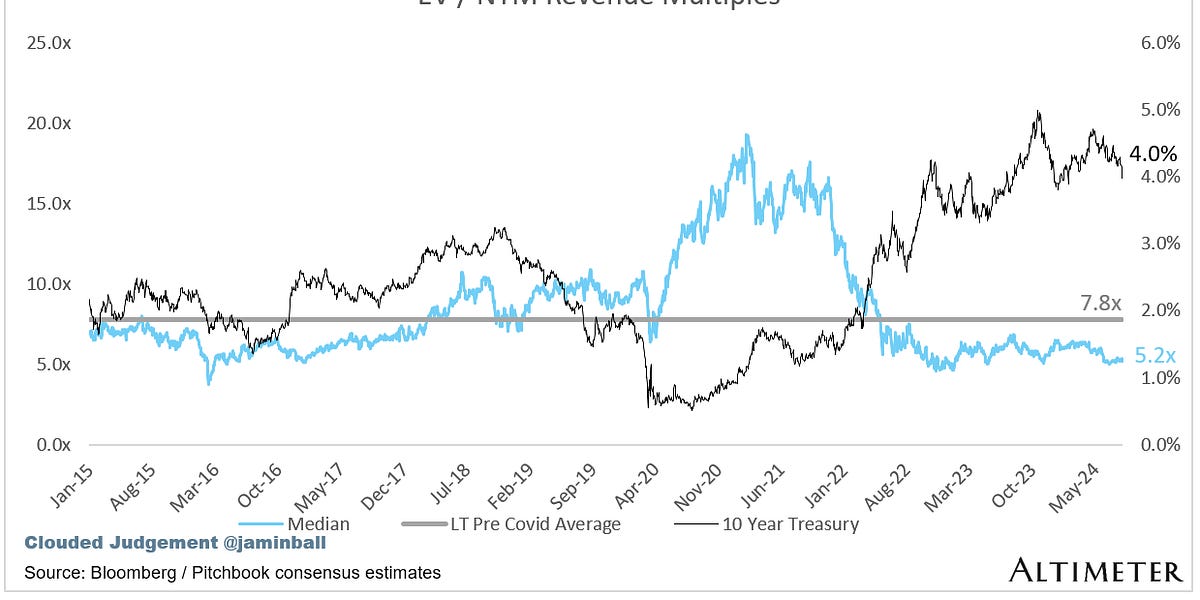
- The 10-year Treasury yield has fallen below 4%, but software company revenue multiples have remained flat, suggesting the market is more concerned about business fundamentals and growth rather than just interest rates.
- There are signs of a potential economic slowdown, such as weaker consumer spending on home goods and discretionary items, particularly in Europe.
- Software companies like Confluent have reported increased short-term cloud cost controls and a focus on driving efficiencies from customers, indicating a tougher environment.
- Of the software companies that have reported Q3 guidance so far, 56% have guided below consensus, and the aggregate net new ARR added in Q2 has been quite poor.
2. How are the big cloud providers performing?
- AWS (Amazon) reported a $100 billion run rate, growing 19% year-over-year.
- Azure (Microsoft) reported an estimated $81 billion run rate, growing 30% year-over-year.
- Google Cloud (including GSuite) reported a $41 billion run rate, growing 29% year-over-year.
[02] AI CapEx
1. What are the key points regarding AI infrastructure investments?
- Meta (Facebook) expects to significantly increase its investments in AI infrastructure next year, as it sees growing demand for its AI and cloud products.
- Microsoft also plans to scale its infrastructure investments, with FY 2025 capital expenditures expected to be higher than FY 2024, dependent on demand signals and adoption of their services.
- The big tech companies are not slowing down their investments in AI infrastructure, as they recognize it as a critical part of the next major paradigm shift in technology.
[03] Quarterly Reports Summary
1. What are the key metrics and trends highlighted in the quarterly reports summary?
- The overall median EV/NTM revenue multiple is 5.2x, with the top 5 median at 14.4x.
- High-growth companies (>27% projected NTM growth) have a median multiple of 9.4x, while mid-growth (15-27%) and low-growth (<15%) companies have medians of 7.6x and 3.7x, respectively.
- The article provides analysis of the EV/NTM revenue multiple relative to NTM growth, EV/NTM FCF, and a scatter plot of EV/NTM revenue multiple vs. NTM revenue growth.
- Key operating metrics are also summarized, including median NTM and LTM growth rates, gross margin, operating margin, FCF margin, net retention, CAC payback, and expense ratios.
Shared by Daniel Chen ·
© 2024 NewMotor Inc.